| ← Back to
Cover |
|
|
|
|
|
|
|
|
|
|
| |
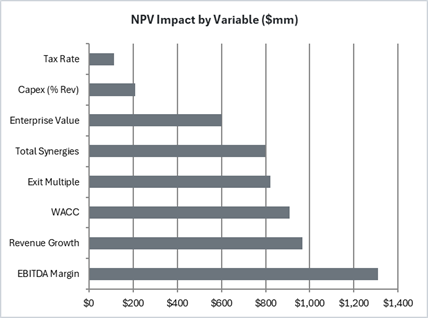
TORNADO CHART DATA — Variable Impact Ranking |
|
| |
Shows how each variable impacts Base Case NPV when
varied between low and high bounds |
|
| |
|
|
| |
|
|
|
|
|
|
|
|
|
|
|
| |
NPV IMPACT BY VARIABLE |
|
IMPACT RANKING (Sorted by Spread) |
|
| |
Variable |
Low Value |
High Value |
NPV at Low |
NPV at High |
Spread ($mm) |
|
Variable |
Spread ($mm) |
% of Max |
|
| |
Exit Multiple |
6.0x |
13.0x |
($934) |
($112) |
$822 |
|
EBITDA Margin |
$1,308 |
100.0% |
|
| |
WACC |
7.0% |
14.0% |
($1,029) |
($121) |
$908 |
|
Revenue Growth |
$966 |
73.9% |
|
| |
Revenue Growth |
1.0% |
10.0% |
($921) |
$45 |
$966 |
|
WACC |
$908 |
69.4% |
|
| |
EBITDA Margin |
15.0% |
30.0% |
($1,192) |
$116 |
$1,308 |
|
Exit Multiple |
$822 |
62.8% |
|
| |
Enterprise Value |
$2,200 |
$2,800 |
($881) |
($281) |
$600 |
|
Total Synergies |
$799 |
61.1% |
|
| |
Total Synergies |
$30 |
$160 |
($397) |
$402 |
$799 |
|
Enterprise Value |
$600 |
45.9% |
|
| |
Tax Rate |
20.0% |
30.0% |
($524) |
($639) |
$115 |
|
Capex (% Rev) |
$209 |
16.0% |
|
| |
Capex (% Rev) |
3.0% |
7.0% |
($738) |
($947) |
$209 |
|
Tax Rate |
$115 |
8.8% |
|
| |
|
|
|
|
|
|
|
| |
|
|
|
|
|
|
| |
Note: Tornado
analysis varies each input individually while holding all others at Base
Case. Spread = |NPV at High - NPV at Low|. Larger spread = higher
sensitivity. |
| |
|
|
|
|
|
|
| |
|
|
|
|
|
|
| |
|
|
|
|
|
|
| |
|
|
|
|
|
|
| |
|
|
|
|
|
|
| |
|
|
|
|
|
|
| |
|
|
|
|
|
|
| |
|
|
|
|
|
|
| |
|
|
|
|
|
|
| |
|
|
|
|
|
|
| |
|
|
|
|
|
|
| |
|
|
|
|
|
|
| |
|
|
|
|
|
|
| |
|
|
|
|
|
|
| |
|
|
|
|
|
|
| |
|
|
|
|
|
|
|
|
|
|
|
|
|
|
|
|
|
|