| ← Back to
Dashboard |
|
|
|
|
|
|
|
|
|
|
|
| |
|
|
|
|
|
|
|
|
|
|
|
|
| |
HISTORICAL
TURNOVER TRENDS |
|
|
|
|
|
|
|
|
|
|
| |
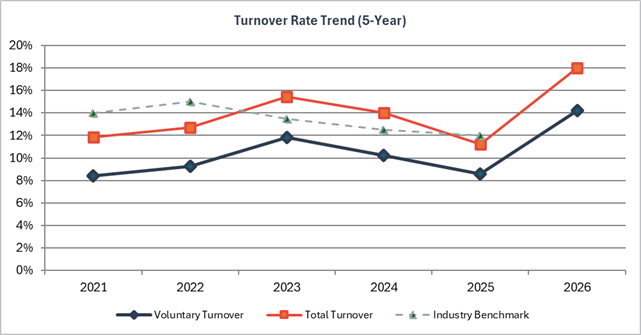
5-Year Turnover Analysis
with Industry Benchmarks |
|
|
|
|
|
|
|
|
|
|
| |
|
|
|
|
|
|
|
|
|
|
|
|
| |
ANNUAL TURNOVER METRICS |
|
QUARTERLY DEPARTURE TRENDS (2025-2026) |
| |
Metric |
2021 |
2022 |
2023 |
2024 |
2025 |
2026 |
|
Quarter |
Departures |
Hires |
Net Change |
| |
Beginning Headcount |
380 |
410 |
440 |
470 |
490 |
500 |
|
Q1 2025 |
14 |
18 |
+4 |
| |
New Hires |
75 |
82 |
78 |
68 |
65 |
65 |
|
Q2 2025 |
16 |
15 |
-1 |
| |
Voluntary Departures |
32 |
38 |
52 |
48 |
42 |
71 |
|
Q3 2025 |
12 |
17 |
+5 |
| |
Involuntary Departures |
13 |
14 |
16 |
18 |
13 |
19 |
|
Q4 2025 |
13 |
15 |
+2 |
| |
Total Departures |
45 |
52 |
68 |
66 |
55 |
90 |
|
Q1 2026 |
11 |
16 |
+5 |
| |
Ending Headcount |
410 |
440 |
450 |
472 |
500 |
475 |
|
Q2 2026 (Est.) |
10 |
14 |
+4 |
| |
|
|
|
|
|
|
|
|
Q3 2026 (Est.) |
9 |
13 |
+4 |
| |
TURNOVER RATES |
|
|
|
|
|
|
|
Q4 2026 (Est.) |
8 |
12 |
+4 |
| |
Voluntary Turnover Rate |
8.4% |
9.3% |
11.8% |
10.2% |
8.6% |
14.2% |
|
Total |
93 |
120 |
27 |
| |
Involuntary Turnover Rate |
3.4% |
3.4% |
3.6% |
3.8% |
2.7% |
3.8% |
|
|
|
|
|
| |
Total Turnover Rate |
11.8% |
12.7% |
15.5% |
14.0% |
11.2% |
18.0% |
|
TOP DEPARTURE REASONS (Last 12 Months) |
| |
Industry Benchmark |
14.0% |
15.0% |
13.5% |
12.5% |
12.0% |
|
|
Reason |
Count |
% of Total |
Trend |
| |
|
|
|
|
|
|
|
|
Better Compensation |
18 |
24.7% |
↑ Increasing |
| |
PERFORMANCE INDICATORS |
|
|
|
|
|
|
|
Career Growth |
15 |
20.5% |
→ Stable |
| |
Avg Engagement Score (1-5) |
3.6 |
3.5 |
3.3 |
3.4 |
3.7 |
|
|
Work-Life Balance |
12 |
16.4% |
↓ Decreasing |
| |
Retention Rate |
88.2% |
87.3% |
84.5% |
86.0% |
88.8% |
82.0% |
|
Manager Relationship |
10 |
13.7% |
↑ Increasing |
| |
YoY Change (Vol. Turnover) |
|
+0.8% |
+2.5% |
-1.6% |
-1.6% |
+5.6% |
|
Relocation |
6 |
8.2% |
→ Stable |
| |
|
|
|
Retirement |
5 |
6.8% |
→ Stable |
| |
|
|
Company Culture |
4 |
5.5% |
↓ Decreasing |
| |
|
|
Other |
3 |
4.1% |
→ Stable |
| |
|
|
Total |
73 |
100.0% |
|
| |
|
|
|
|
|
|
| |
|
|
|
|
|
|
| |
|
|
|
|
|
|
| |
|
|
|
|
|
|
| |
|
|
|
|
|
|
| |
|
|
|
|
|
|
| |
|
|
|
|
|
|
| |
|
|
|
|
|
|
| |
|
|
|
|
|
|
| |
|
|
|
|
|
|
| |
|
|
|
|
|
|
| |
|
|
|
|
|
|
| |
|
|
|
|
|
|
| |
|
|
|
|
|
|
| |
Note: Historical data is
sample/placeholder. Replace with actual HR records. 2026 estimates use
current model parameters. Industry benchmarks sourced from BLS/SHRM data. |
|
|
|
|
|
|
|
|
|
|
|
|
|
|
|
|
|